- 您現在的位置:買賣IC網 > Datasheet目錄13 > GM1JJ35200AE (Sharp Microelectronics)LED ORANGE 627NM CLEAR LENS 1608 Datasheet資料下載
參數資料
| 型號: | GM1JJ35200AE |
| 廠商: | Sharp Microelectronics |
| 文件頁數: | 2/3頁 |
| 文件大小: | 74K |
| 描述: | LED ORANGE 627NM CLEAR LENS 1608 |
| 產品目錄繪圖: | GM1 Series 1608 Side GM1 Series 1608 Schematic GM1 Series 1608 Bottom |
| 標準包裝: | 1 |
| 顏色: | 橙 |
| Millicandela 等級: | 19mcd |
| 正向電壓: | 2V |
| 電流 - 測試: | 5mA |
| 波長 - 主: | 618nm |
| 波長 - 峰值: | 627nm |
| 透鏡類型: | 透明 |
| 透鏡樣式/尺寸: | 矩形,帶平頂,1mm x 0.8mm |
| 封裝/外殼: | 0603(1608 公制) |
| 尺寸/尺寸: | 1.60mm L x 0.80mm W |
| 高度: | 0.35mm |
| 安裝類型: | 表面貼裝 |
| 包裝: | 剪切帶 (CT) |
| 其它名稱: | 425-1811-1 |
52
Notice In the absence of confirmation by device specification sheets,SHARP takes no responsibility for any defects that may occur in equipment using any SHARP devices shown in
catalogs,data books,etc.Contact SHARP in order to obtain the latest device specification sheets before using any SHARP device.
Internet Internet address for Electronic Components Group http://sharp-world.com/ecg/
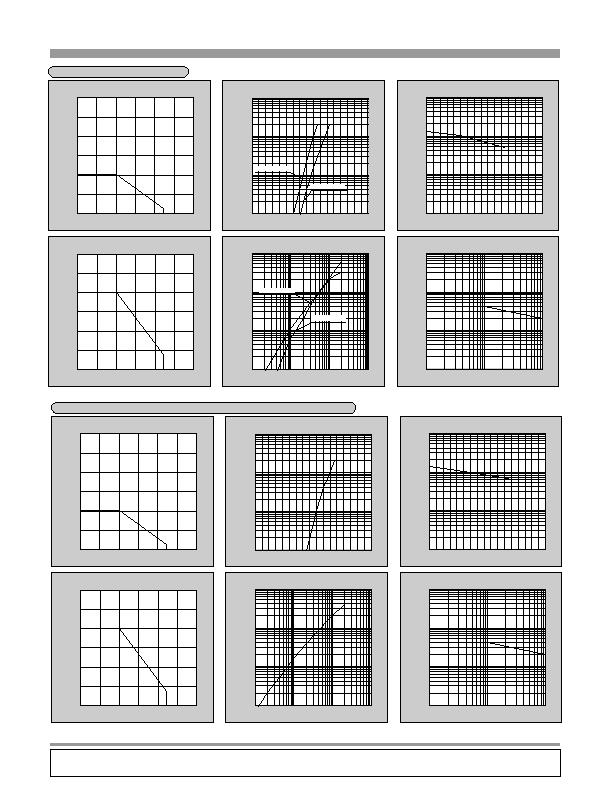
Characteristics Diagrams
0
10
20
30
40
50
60
|30 0 25 50 75 85
125
100
Peak Forward Current Derating Curve
Ambient temperature Ta(贑)
0
10
20
30
40
50
60
|30 0 25 50 75 85
125
100
Forward Current Derating Curve
Ambient temperature Ta(贑)
0.1
0.5
1.0
5.0
10
50
100
1.0 1.2 1.4 1.6 1.8 2.0
2.4 2.6
2.2
Forward Current vs. Forward Voltage(Note)
Forward voltage VF(V)
iTa 25 j
1.0
5.0
10
50
100
500
1000
|20 0 20 40 60 80
120
100
Luminous Intensity vs. Ambient Temperature(Note)
Ambient temperature Ta(贑)
iTa 25 j
1.0
5.0
2.0
10
20
50
100
200
500
1000
0.1 0.2 0.5 1 2 5 10 20 50 100
Luminous Intensity vs. Forward Current(Note)
Forward current IF(mA)
iTa 25 j
1.0
5.0
2.0
10
20
50
100
200
500
1000
1/50 1/20 1/10 1/5 1/2 1
Duty Ratio vs. Peak Forward Current
Duty ratio DR
iTa 25 j
GM1JV55200AE
GM1JS55200AE
GM1JV55200AE
GM1JS55200AE/GM1JV55200AE
GM1JS55200AE
GM1JO40300AE series, GM1JO35200AE series, LT1JO67A series, LT1JO45A series
0
10
20
30
40
50
60
-30 0 25 50 75 85
125
100
Peak Forward Current Derating Curve
Ambient temperature Ta(贑)
0
10
20
30
40
50
60
-30 0 25 50 75 85
125
100
Forward Current Derating Curve
Ambient temperature Ta(贑)
0.1
0.5
1.0
5.0
10
50
100
1.0 1.2 1.4 1.6 1.8 2.0
2.4 2.6
2.2
Forward Current vs. Forward Voltage(Note)
Forward voltage VF(V)
1.0
5.0
10
50
100
500
1000
-20 0 20 40 60 80
120
100
Luminous Intensity vs. Ambient Temperature(Note)
Ambient temperature Ta(贑)
1.0
5.0
2.0
10
20
50
100
200
500
1000
0.1 0.2 0.5 1 2 5 10 20 50 100
Luminous Intensity vs. Forward Current(Note)
Forward current IF(mA)
(Ta=25贑)
(Ta=25贑)
(Ta=25贑)
Note)Characteristics shown in diagrams are typical values. (not assurance value)
1.0
5.0
2.0
10
20
50
100
200
500
1000
1/50 1/20 1/10 1/5 1/2 1
Duty Ratio vs. Peak Forward Current
Duty ratio DR
iTa 25 j
相關PDF資料 |
PDF描述 |
|---|---|
| GM1WA55311A | LED RED/GRN/BLU 1.6X1.6 CLR SMD |
| GM4BW63360A | LED PSUEDO WHITE 1.5CD SMD |
| GM4WA25300A | LED RED/GRN/BLU 5X2.5X2.5 SMD |
| GM5BW05340A | LED PSUEDO WHITE 10CD 5X5 SMD |
| GM5BW96320A | LED PSUEDO WHITE 3.2X2.8 SMD |
相關代理商/技術參數 |
參數描述 |
|---|---|
| GM1JJ40300AE | 制造商:未知廠家 制造商全稱:未知廠家 功能描述:HIGH-LUMINOSITY LED LAMP |
| GM1JJ55200AE | 制造商:未知廠家 制造商全稱:未知廠家 功能描述:HIGH-LUMINOSITY LED LAMP |
| GM1JR35200AE | 功能描述:標準LED-SMD 1.6 x 0.8 x 0.35 Chip LED Red RoHS:否 制造商:Vishay Semiconductors 封裝 / 箱體:0402 LED 大小:1 mm x 0.5 mm x 0.35 mm 照明顏色:Red 波長/色溫:631 nm 透鏡顏色/類型:Water Clear 正向電流:30 mA 正向電壓:2 V 光強度:54 mcd 顯示角:130 deg 系列:VLMx1500 封裝:Reel |
| GM1JS35200AE | 功能描述:標準LED-SMD 1.6 x 0.8 x 0.35 Chip LED Sunset Orng RoHS:否 制造商:Vishay Semiconductors 封裝 / 箱體:0402 LED 大小:1 mm x 0.5 mm x 0.35 mm 照明顏色:Red 波長/色溫:631 nm 透鏡顏色/類型:Water Clear 正向電流:30 mA 正向電壓:2 V 光強度:54 mcd 顯示角:130 deg 系列:VLMx1500 封裝:Reel |
| GM1JS40300AE | 制造商:未知廠家 制造商全稱:未知廠家 功能描述:HIGH-LUMINOSITY LED LAMP |
發(fā)布緊急采購,3分鐘左右您將得到回復。