- 您現(xiàn)在的位置:買賣IC網(wǎng) > PDF目錄385355 > HCA600ACREF (Intersil Corporation) 600W/1000W Full Bandwidth Class D Amplifier PDF資料下載
參數(shù)資料
| 型號: | HCA600ACREF |
| 廠商: | Intersil Corporation |
| 英文描述: | 600W/1000W Full Bandwidth Class D Amplifier |
| 中文描述: | 600W/1000W全帶寬D類放大器 |
| 文件頁數(shù): | 5/11頁 |
| 文件大小: | 351K |
| 代理商: | HCA600ACREF |
5
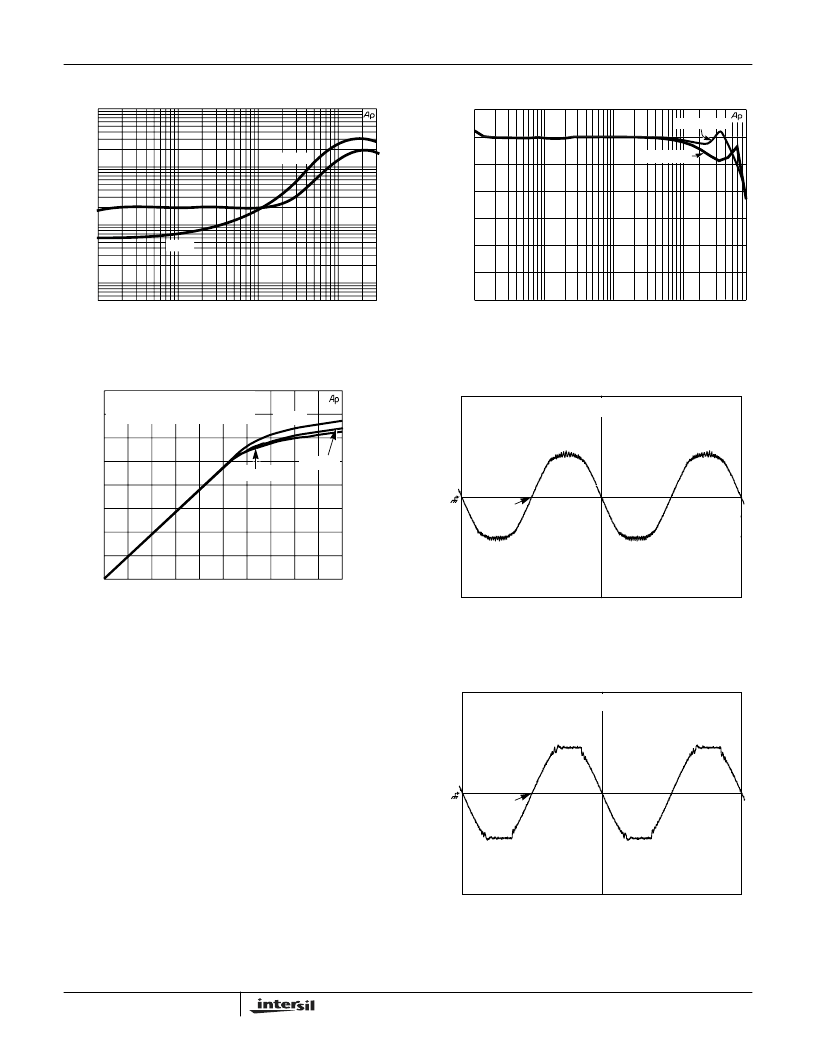
Typical Performance Curves
FIGURE 1. THD +N (%) vs FREQUENCY LOAD = 8
FIGURE 2. AMPLIFIER FREQUENCY RESPONSE
10W - LOAD = 8
FIGURE 3. AMPLIFIER TRANSFER CHARACTERISTIC WITH
VARIOUS SETTINGS OF SOFT CLIPPING
RESISTOR
FIGURE 4. OSCILLOSCOPE DISPLAY OF AMPLIFIER
OUTPUT WITH SOFT CLIPPING CIRCUIT
ENABLED
Soft Clipping
Figures 3, 4 and 5 show the effects of the soft clipping
circuitry within the amplifier. Figure 3 shows the transfer
characteristic of the amplifier for various values of the soft
clipping programming resistor. An important aspect of soft
clipping is the apparent increase in sound level. As soft
clipping is reached, the upper and lower envelop of the
sinewave is gradually reduced. This “soft” rounding reduces
the higher harmonics that would result if hard clipping as
shown in Figure 5 was enabled. Soft clipping also results in
an amplifier with a more pleasing sound. Figure 4 shows the
rounding of the output with soft clipping, while Figure 5
shows the ampler output without soft clipping.
FIGURE 5. OSCILLOSCOPE DISPLAY OF AMPLIFIER
OUTPUT WITH SOFT CLIPPING CIRCUIT
DISABLED
1
0.1
0.01
0.001
0.0005
10
100
1k
10k
30k
T
FREQUENCY (Hz)
400W
20W
10
100
1k
10k
80k
FREQUENCY (Hz)
1.000
0.0
-1.000
-2.000
-3.000
-4.000
-5.000
-6.000
A
LOAD = 4
LOAD = 8
0.0
13.0
26.0
39
52
65
78
90
0.0
0.6 0.12 0.18 2.4
3.0
3.6
4.2
4.8
5.2
6.0
1012
760
528
338
190
84
21
0.0
INPUT VOLTAGE (V
RMS
)
O
R
)
O
R
)
LOAD = 8
AMPLIFIER OUTPUT vs INPUT
R = 20K
R = 10K
R =
∞
1
1ms/DIV
DSA 602A DIGITIZING SIGNAL ANALYZER
1
1ms/DIV
DSA 602A DIGITIZING SIGNAL ANALYZER
HCA600ACREF
相關(guān)PDF資料 |
PDF描述 |
|---|---|
| HCD17010.0MHz | 12V OCXO Sine Output |
| HCD71 | 12V OCXO Sine Output |
| HCD710 | 12V OCXO Sine Output |
| HCD7110.0MHz | 12V OCXO Sine Output |
| HCD170 | OCXO Sine Output |
相關(guān)代理商/技術(shù)參數(shù) |
參數(shù)描述 |
|---|---|
| HCA6306 | 制造商:未知廠家 制造商全稱:未知廠家 功能描述:ASIC |
| HCA6312 | 制造商:未知廠家 制造商全稱:未知廠家 功能描述:ASIC |
| HCA6324 | 制造商:未知廠家 制造商全稱:未知廠家 功能描述:ASIC |
| HCA6348 | 制造商:未知廠家 制造商全稱:未知廠家 功能描述:ASIC |
| HCA6AC0187-05AI | 制造商:TE Connectivity 功能描述: |
發(fā)布緊急采購,3分鐘左右您將得到回復(fù)。